Litlyx
Litlyx is a traffic analytics platfform. The platform is 100% GDPR compliant and was founded in Italy, Europe.
Installing Litlyx on a documentation platform results in statistics and usage tracking of the documentation.
Installing Litlyx
Section titled “Installing Litlyx”-
Go to the Official Webpage and sign up for an account.
-
When logged in, click on Create Workspace.
-
In the menubar, click on Web.
-
Copy the script tag that is being displayed.
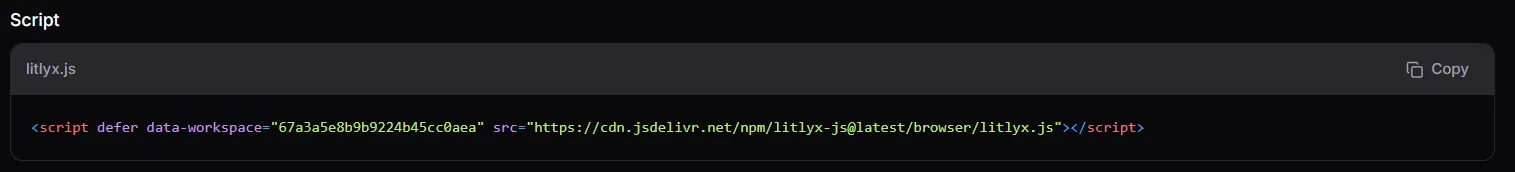
-
Paste the script tag in your repository in
index.htmlinside the<header>. -
Publish your documentation platform and click anywhere on the page to trigger an action.
-
Open Litlyx and verify the installation.
Dashboard
Section titled “Dashboard”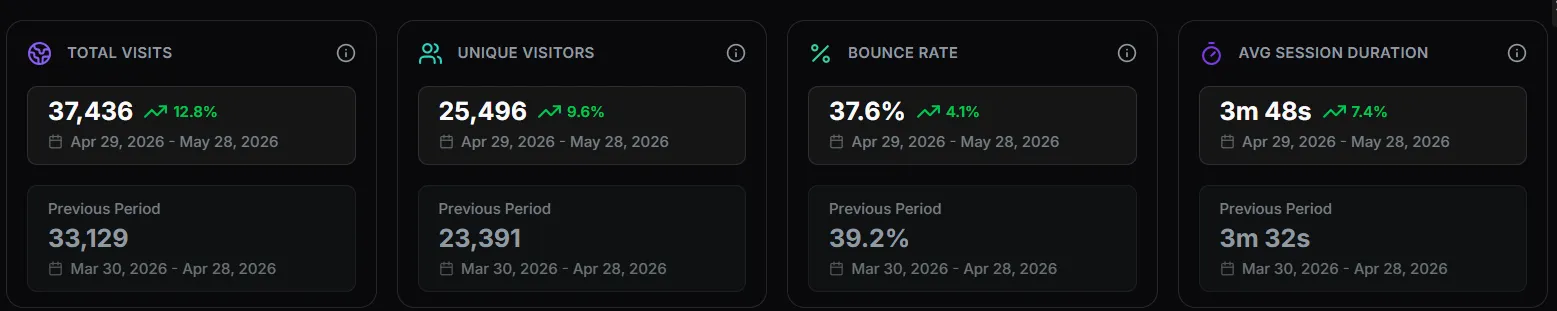
The dashboard inside your workspace in Litlyx displays the following:
- Total visits.
- How many times have your webpage being visited the previous month.
- Unique visitors.
- How many unique visitors did your webpage have previous month.
- Bounce rate.
- How many of your visitors did any interaction. For example, clicked a button or downloaded a file.
- Average session duration.
- How long time did your users on average spend on your webpage during a session.
Generate a Report
Section titled “Generate a Report”Litlyx can generate a report of the traffic to your webpage in a PDF-format. For best result, wait a month before to get full data for the report. Follow this step list to generate a report.
-
Open your workspace in Litlyx.
-
In the menubar, click Report.
-
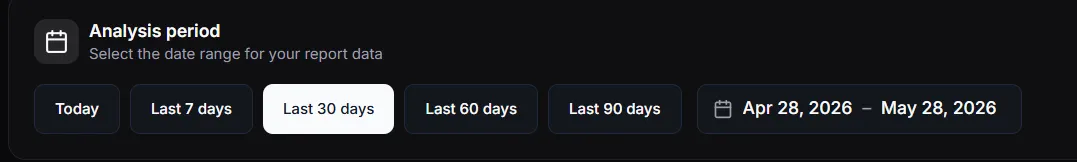
Select a timeframe for the report by selecting Start Period of the Report and End Period of the Report in the dropdown menus.
-
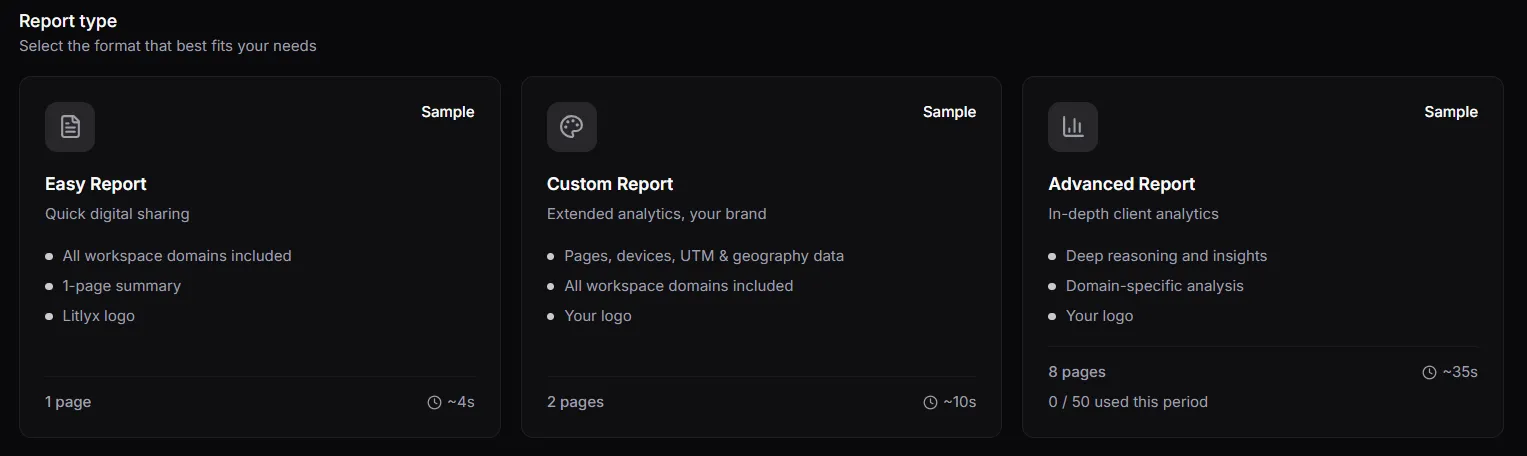
Select a report type.
-
Click on the button Generate Report.

Litlyx has now generated a report in a PDF-format.